Metered every thirty minutes
Electricity, gas, water and heat, half hour by half hour: the day as the building lived it.
Powerscope Insights
Your whole portfolio, metered and turned into reporting your bank will accept.
What Insights reads
Signals
Electricity, gas, water and heat
Cadence
Every thirty minutes
Carbon
Scope 1 and 2, live from the meters
Risk
CRREM stranding, per building
In the product
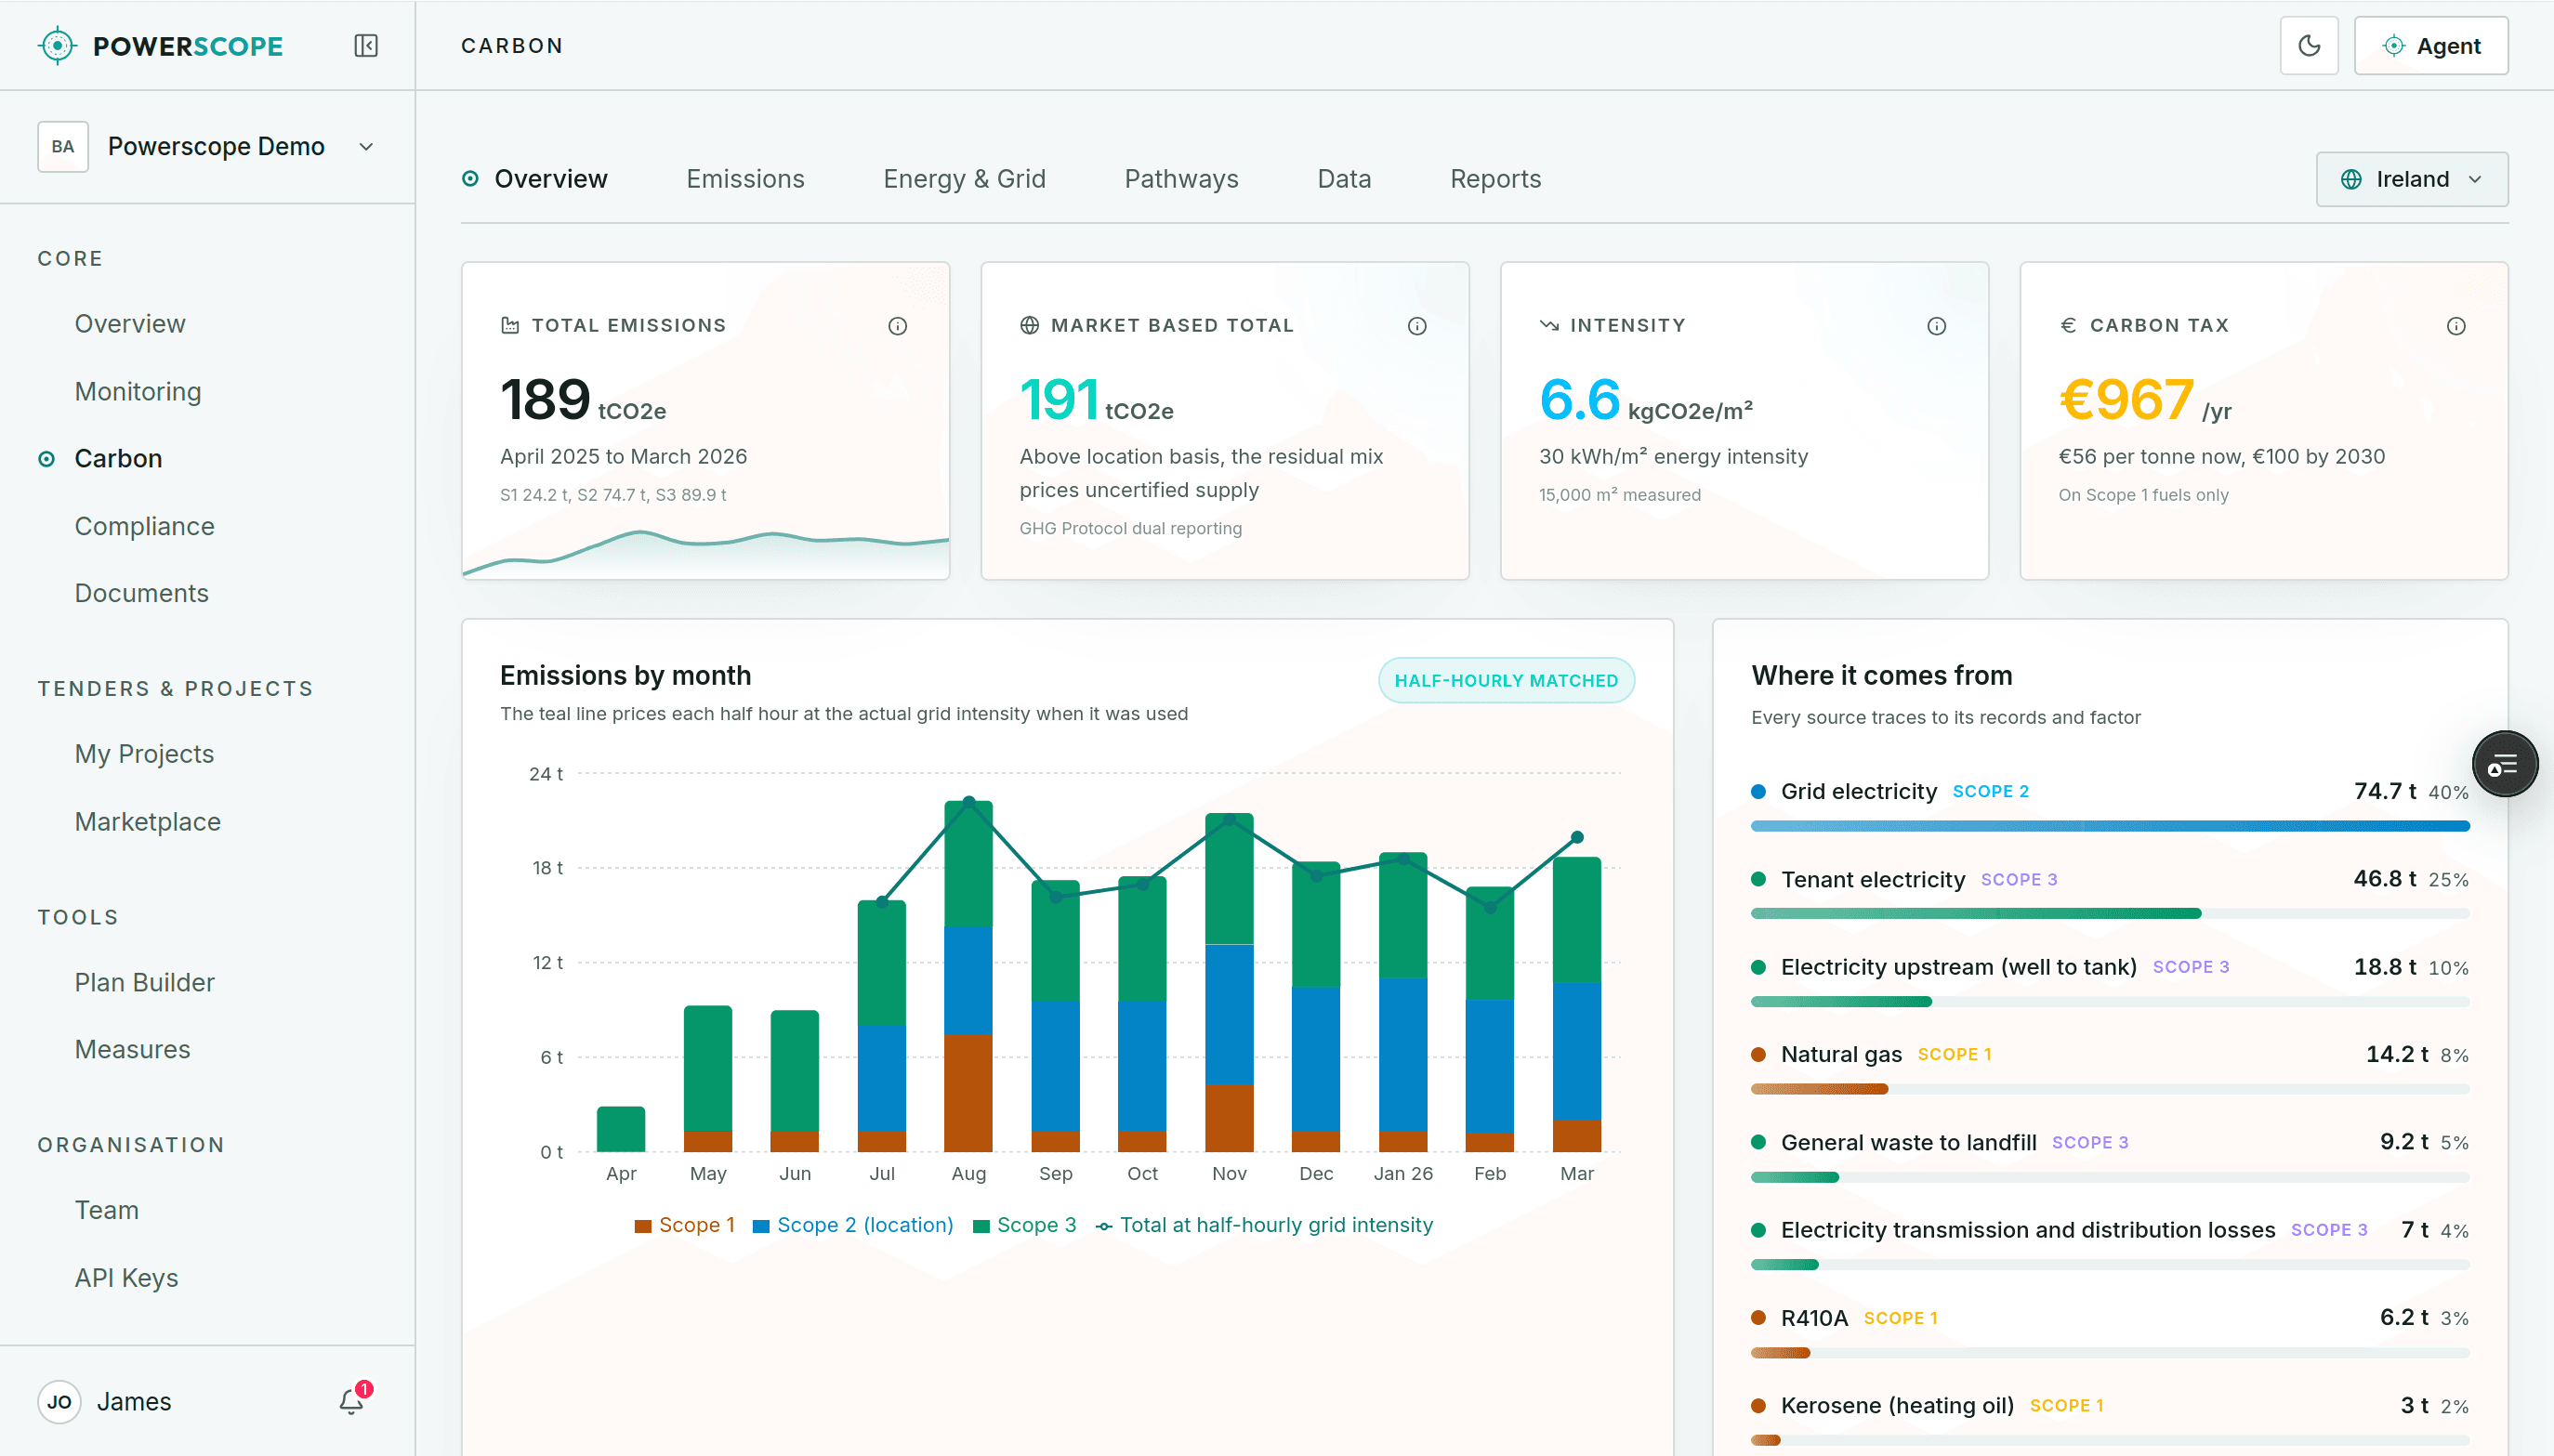
Monitoring, reporting, compliance and carbon read from the same half-hourly meters.
01
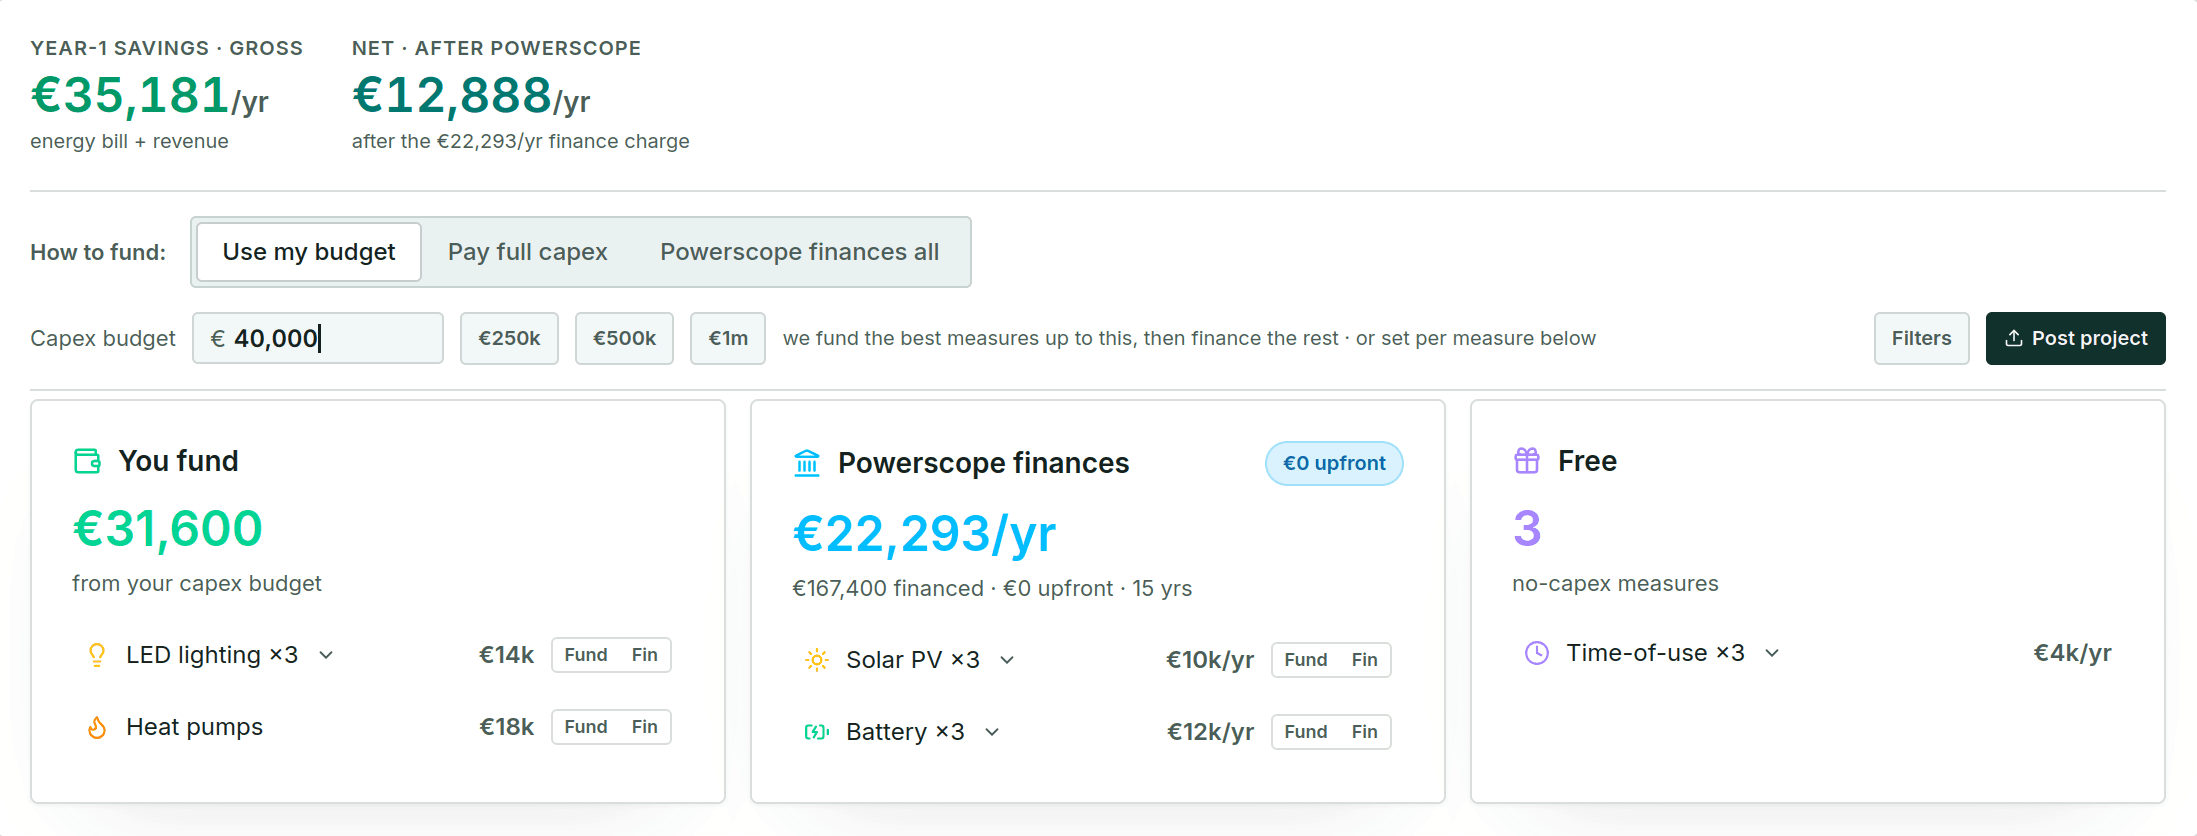
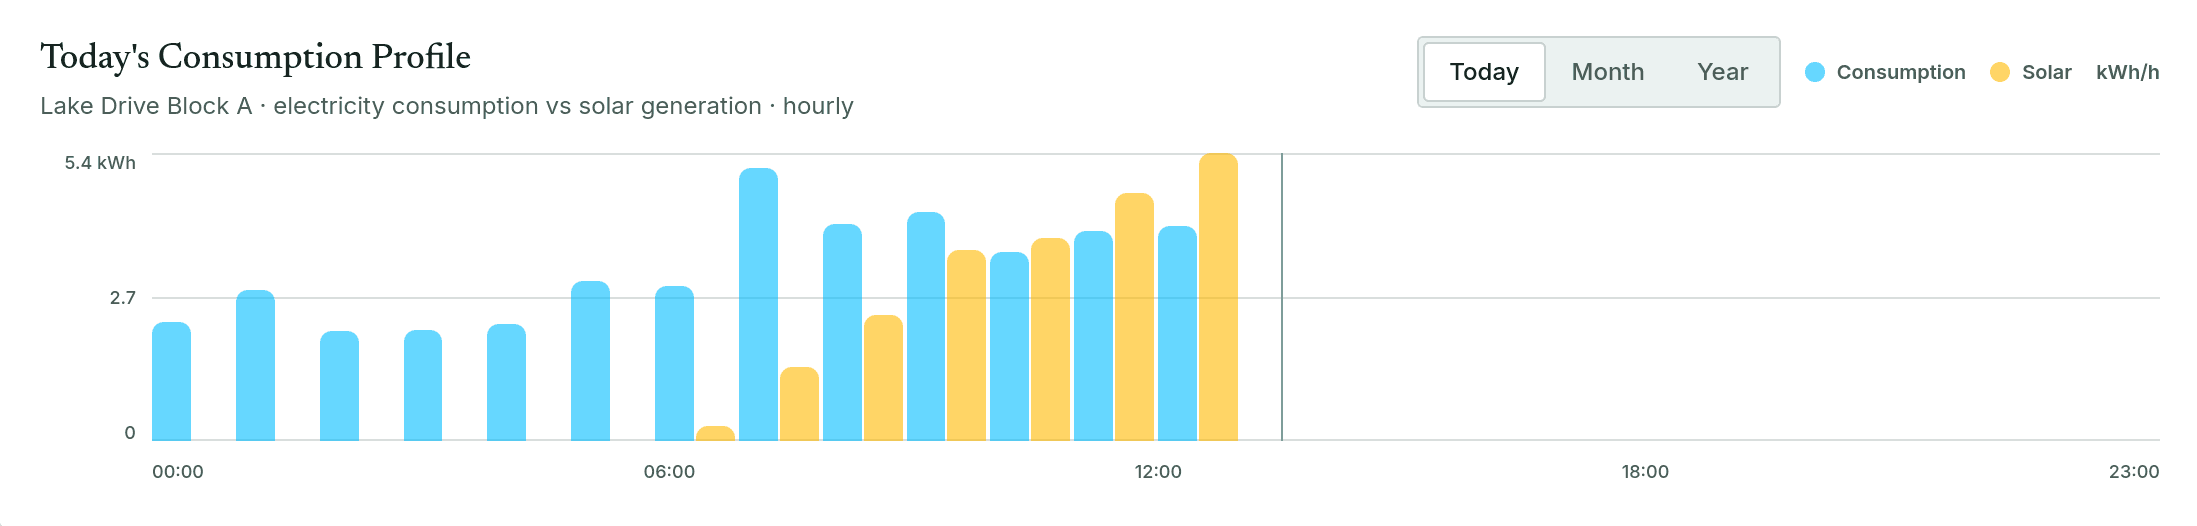
Consumption per site, half hour by half hour, reading gaps flagged as they happen. How the charge is sized
Example data
01 / 05 · Live monitoring
The instrument
Hover to inspect any half hour.
One day · metered every 30 minutes
Example office portfolio
The data story
Every project starts and ends here: the same half-hourly readings make the case, then verify it.
Electricity, gas, water and heat, half hour by half hour: the day as the building lived it.
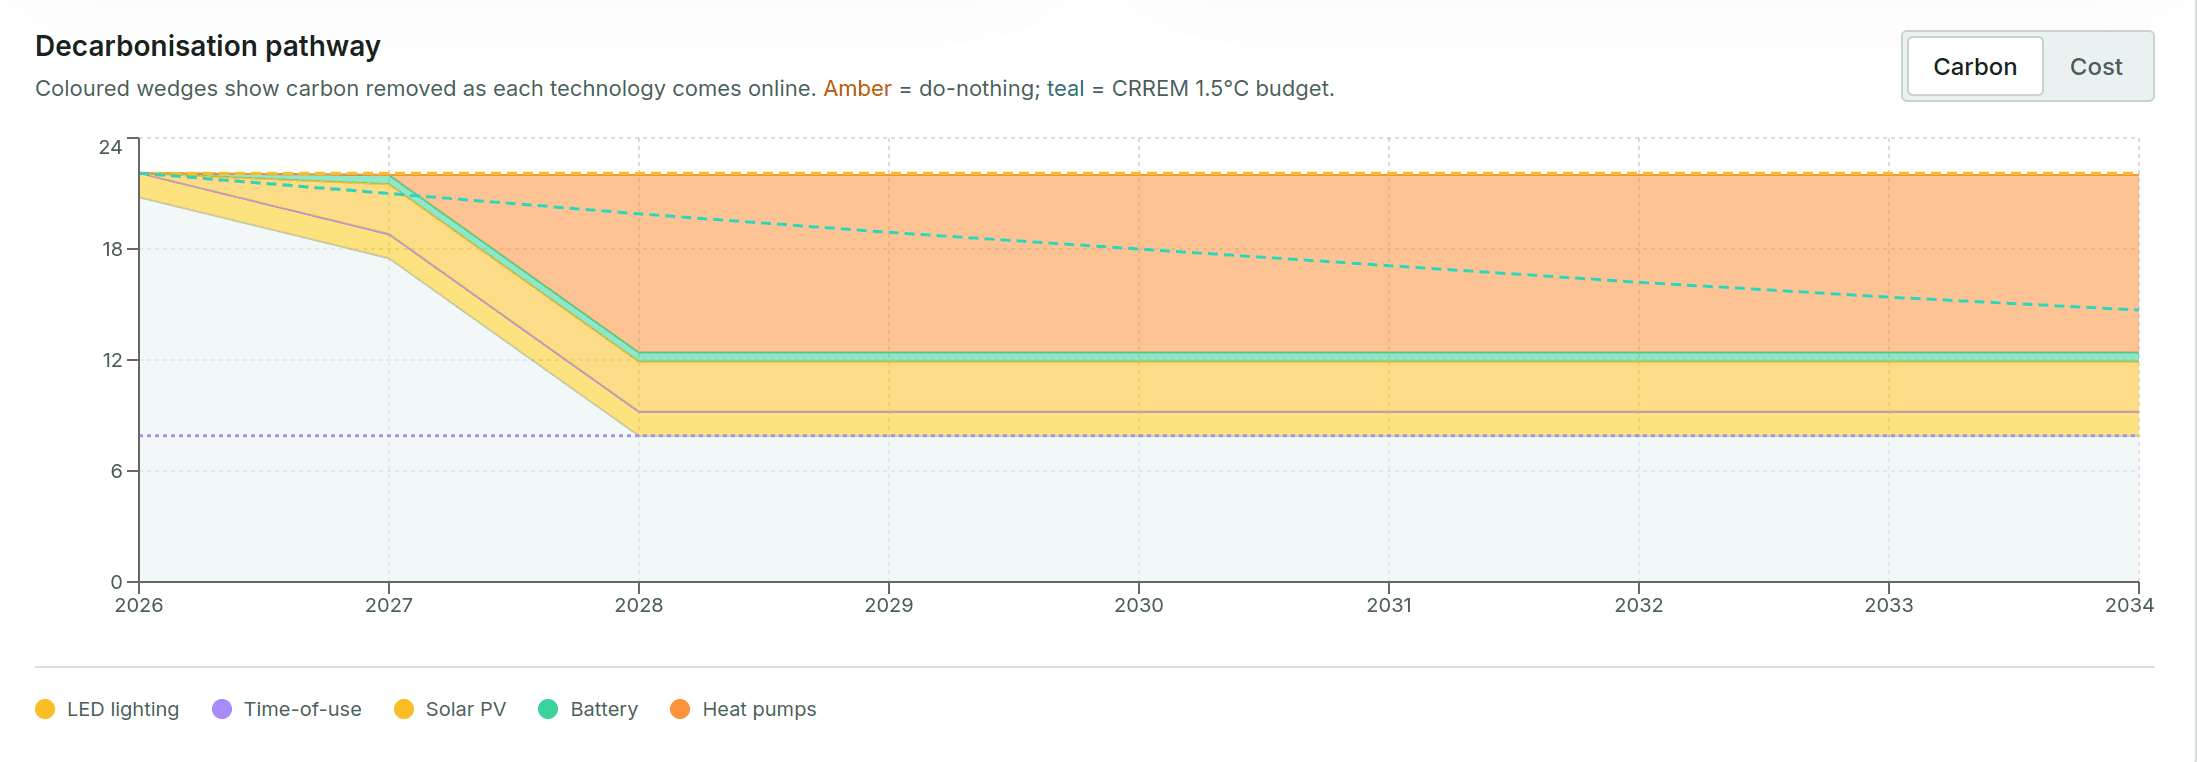
The same day re-run with solar, battery and LED in place. The shaded gap is the saving.
The readings that size the measures also fix the finance charge, then verify delivery. See how tracking closes the loop · How the financing works
Carbon reporting
Not a score or a badge: a full GHG Protocol inventory built from metered data, in the formats lenders and frameworks actually request.
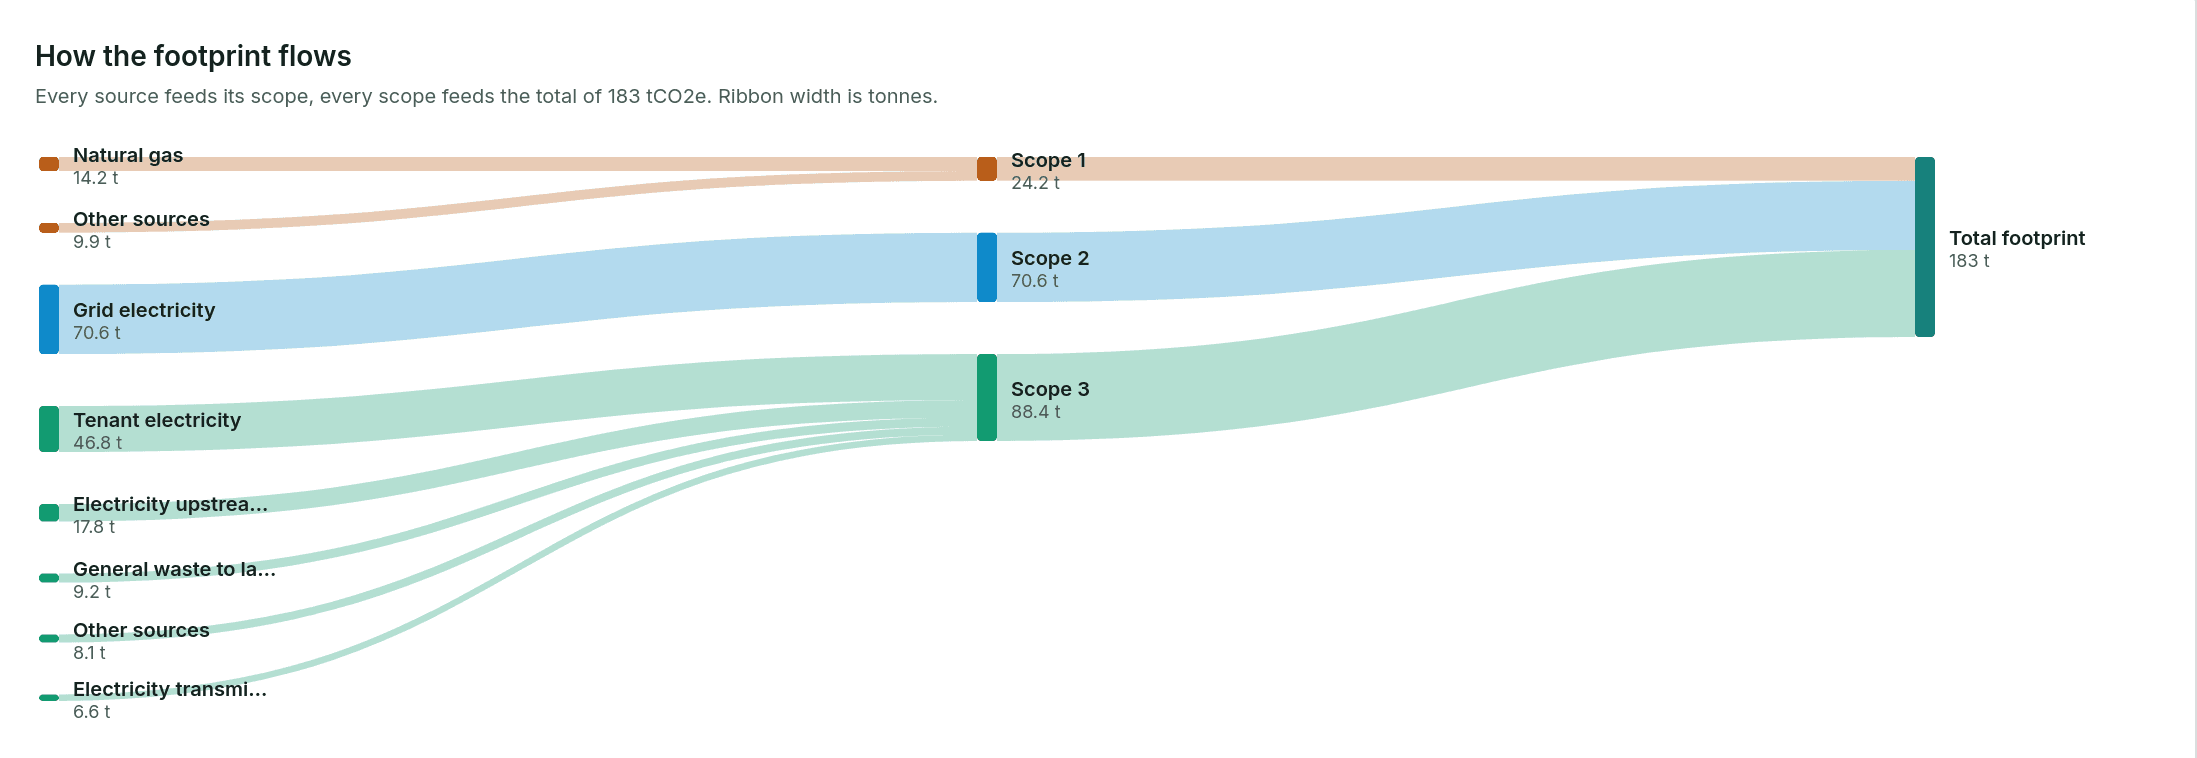
Scope 1, 2 and 3 computed from your meters and records, location and market based.
Each line carries its meter reading and emission factor version, ready for an auditor.
VSME, ESRS E1, GRESB, lender packs and the full inventory, from one dataset.
Every asset tested against its 1.5 degree pathway: which buildings are at risk, and when.
Monitoring & modelling
Insights is the layer that tells you the truth about your buildings.
Monitoring runs from a simple monthly fee per building. No hardware lock-in.
Connect a building and we will show you where the savings are, what they are worth, and which measures to do first.